The inflationary crisis of the last three years represents a major turning point for hundreds of millions of workers. In many countries, wages are no longer automatically adjusted to inflation. As long as inflation varied between 1.5% and 2.5%, the erosion of purchasing power could easily be countered by collective agreements to adjust wages in line with changes in the cost of living.
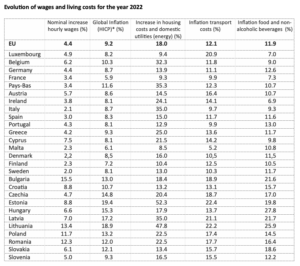
Over the course of 2022, according to calculations by the European Trade Union Institute (ETUI) ([1]), the most basic expenses, such as energy, food, housing and transport costs, have risen up to four times faster than wages. Although the average hourly wage also rose by 4.4%, the inflation rate was 9.2% for the EU as a whole [2].
Real wages, which provide the only relevant information on pay trends after inflation has been taken into account, therefore suffered a significant decline in all EU Member States, as well as in almost all countries, including the UK or USA.
This situation had nothing to do with the ‘stagflation’ of the 1970s, as corporate net profits rose and profit margins remained at high levels in most countries. It was in response to this situation that economists spoke of greedflation, based on the existence of excess profits, monopoly rents and price rises linked to speculation.
The question of excess profits and profit margins that remained high despite the pandemic is far from trivial, but I prefer to deal with it later in a separate article dedicated to this aspect.
In this first article, I believe it is essential to focus on the effects of the inflationary surge of recent years. I will begin by presenting four graphs that largely speak for themselves. The first shows the trend in average inflation in the EU. The second shows cumulative inflation between the fourth quarter of 2021 and the first quarter of 2023. The third graph shows the trend in real wages, which I propose to refine by showing the extent of the fall in real wages by sector of activity and level of qualification.
Fig 1 – Annual inflation rate in the EU (Jan 1997 – June 2023)
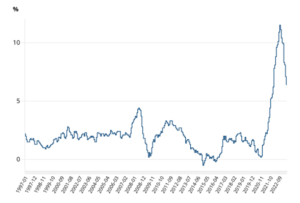
Fig 2 – Cumulated inflation rate between Q4-2021 and Q1-2023, per country
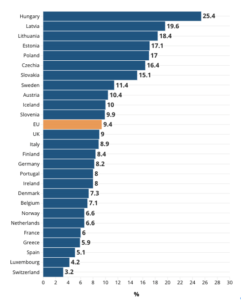
The overall trend is clearly identifiable: the inflationary shock has resulted in a loss of purchasing power and a fall in real wages of around 4-5% on average, with larger declines of 7-8 or 10% in some countries. These variations are primarily the result of measures to limit price rises or of spontaneous or stimulated wage compensation.
Fig. 3 – Evolution of real wages (hourly basis) between Q1-2022 and Q1-2023
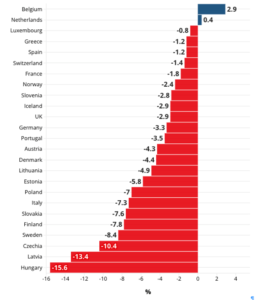
Belgium is the only country where real wages rose slightly between quarter 1 of 2022 and the first quarter of 2023. This is explained by the existence of an automatic indexation system, applied to both the private and public sectors, with admittedly some time lags and slight variations, but overall 98% of workers, recipients of minimum social benefits or pensioners have seen their pay adjusted in line with inflation.
Figure 4 – Evolution of real wages following level of payment / type of activity between Q1-2022 and Q1-2023

The haemorrhaging of purchasing power seems to have stopped in 2023, even though the European Trade Union Institute notes that real wages continued to fall by an average of 0.8% in the second quarter of 2023 (compared with the same quarter of 2022) [3].
But the concern remains as said ETUC General Secretary Esther Lynch : “Trade unions have won much-needed pay rises that have protected our members from the worst effects of the cost of living crisis driven by corporate profits. But there are too many loopholes that allow companies to sidestep collective bargaining. Two years after the start of the inflationary crisis, workers’ purchasing power has still not been properly restored.” For Esther Lynch, this situation is not only causing misery for millions of workers and their families, but it is also pushing economies towards a new recession. “We desperately need to put more money into the pockets of working people, who reinvest it in the local economy, instead of letting the ultra-rich pile billions into their offshore accounts. With the next European elections coming up, we call on our 45 million members to vote for parties that will give workers the power to win fair and just pay rises.”
The lowering of shrinking real wages is primarily the result of lower inflation, which will fall from 12% in October 2022 to 4% towards the end of 2023. However, there is no sign that a wage catch-up has begun. Although the ECB and the European Commission are predicting an average rise in wages of 5.9% in 2023 for the eurozone, this is far from offsetting the fall in real wages over the last year. For the WSI economists at the Hans Böckler-stiftung, there is no doubt that on a cumulative basis, from 2021 to 2024, real wages will have recorded a net decline of between 5% and 10%, except for Belgium, which therefore appears to be an ‘anomaly’. I’ll come back to this in an article specifically devoted to the Belgian automatic indexation system and its possible extension to other countries.
In the meantime, I would like to point out that even in the upper echelons of the European Commission, forecasts are very cautious about the possibilities of a wage catch-up. Indeed, the report Labour Markets and wage development in 2023, published at the beginning of 2024 under the responsibility of DG Employment and Social Affairs and Inclusion, notes that “the losses in real wages that have been recorded since the end of 2021 are weighing on household purchasing power and continuing to wreak havoc (sic). The financial distress of workers has increased significantly and the rate of material and social deprivation among all workers has risen considerably.” (sic again). At the same time, it is noted that “the social shock caused by the inflationary crisis has been less brutal than the effects caused by the financial crisis of 2007-2008, thanks in particular to the resilience of labour markets and the effectiveness of the response to the crisis at EU and national level”. The report’s authors note a number of trends which I find most worrying:
• The trend towards wage convergence between EU Member States is waning or even being reversed;
• Wage discrpancy between Member States, both within and outside the eurozone, tend to increase;
• Wage inequalities within Member States are widening, and there has been a marked increase in the proportion of low-paid workers, especially women. The combination of low pay and involuntary part-time work leads these workers into a situation of in-work poverty from which it is difficult to escape;
• Last but not least, the major trend of wage stagnation that began in the wake of the 2008 financial crisis is being confirmed and is moving in some countries towards a downward trend in real wages. Part of the workforce is in the process of moving from a situation of “permanent wage moderation” to one of structural in-work poverty. Figure 5 illustrates these findings perfectly.
Fig 5 – Annual evolution of nominal and real wages for euro-zone (2000-2022)
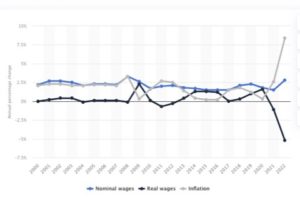
Italy is the country that best embodies the shift from stagnation to falling wages. However, France is not to be outdone – especially since 2017 – as it appears that real wages there are undergoing a significant erosion that not even the increase in the Smic, even though it is indexed to inflation, seems able to counteract.
Fig 6 – Evolution of average wage in France (2015-2023).
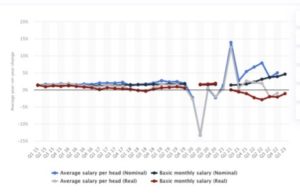
While it is true that data from Eurostat, the ECB, the OECD and the World Bank (as reported on the Statista website) show variations, these in no way contradict the fundamental features we have identified here. Indeed, the overall diagnosis is the same: after a decade of wage moderation, recent years have been characterised by a fall in real wages of between 4% and 5%, and sometimes more. At the same time, there is one country – Belgium – where wage earners as well as benefit takers or pensioners are protected for the rising cost of living.
Admittedly, the ‘anomaly’ represented by the Belgian case is not as such able to reverse the global trend, but its case also reveals that it is possible to protect purchasing power while preserving a certain economic vigour. In fact, the automatic indexation of wages and minimum social benefits has not led to higher inflation or a drop in business competitiveness, but has instead supported economic activity with a growing GDP of 1.4 while other countries like France of Germany almost slieded into recession.
For the editorial writers of the Financial Times, there is no doubt that wage compression and the erosion of purchasing power are factors fuelling the general economic sluggishness that began with the great recession of 2008. The ‘polycrisis’ – a somewhat evasive notion that refers to the systemic crisis of capitalism – is therefore also and above all a crisis of the neoliberal model.
Figure 7 – Average annual wages in 2022 in constant prices and local currency, indexed to 2000
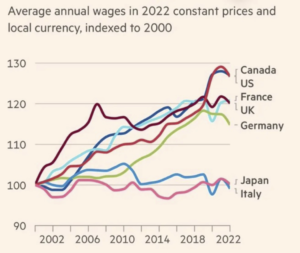
Clearly, this neoliberal growth model, propelled by the globalisation of trade and increasing financialization, is no longer capable of generating growth (which, incidentally, is not sustainable) or guaranteeing prosperity for large sectors of the population, not only for the working classes but also for sectors of the middle classes. Of course, income from capital is not doing too badly – to say the least – but for those socio-professional categories who derive their income from work (predominantly salaried, if not ‘self-employed’ or linked to small-scale economic activities), times are getting tougher and tougher. This diagnosis certainly deserves to be refined, by taking into account, for example, the importance of property wealth or capital income from investments, which protect both old and new generations from being downgraded to the ‘world below’.
Even if it was temporary – which is far from certain in view of the ecological crisis and growing geopolitical tensions – the rise in inflation has acted as an accelerator of social inequalities, which are ultimately a reflection of class inequalities…
That’s why, if we ever had to represent society visually, we’d have to start by drawing a shape that doesn’t look like a rhombus, but rather a sort of figure 8, with the top half widening, the middle half contracting and the bottom half swelling…
To understand this process, it is no longer enough to talk about ‘social downgrading’ – from which class to which other social class? – or to lament about how hard upward social mobility has become, but to recognize that large sectors of the population are undergoing a kind of objective and subjective ‘re-proletarianisation’. In the absence of collective social mobilisation, this development translates into fierce competition to maintain one’s social rank, if not to try to climb the social ladder in a competition where the losers far outnumber the winners. Social interactions tend to become increasingly utilitarian, subject to the imperative of self-valorization, and resemble increasingly to an incessant social competition or ‘positional struggle’.
But the society of über-competing individuals is obviously also a source of frustration and resentment. It is quite obvious that the scale of this process of ‘reproletarisation’ and its seemingly irresistible nature also explains why social exasperation feeds the ‘retropic’ rhetoric that stirs up hopes of a return to the golden age of prosperity that should be based on ethnocentrism and a racist and classist rejection of the most vulnerable instead of solidarity and distributive justice.
In case the tone of these comments is too ideological, I strongly recommend reading some objective data such as the Gini index. The Gini index (or coefficient) is a synthetic indicator of the extent of social inequality (income and wealth). Varying between 0 (perfect equality) and 1 (extreme inequality), the higher the Gini index, the greater the inequality. Close to zero, we have a very egalitarian society; above 0.25 or 0.30, inequalities exist but are contained, and above 0.40, society becomes extremely unequal.
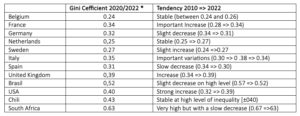
(sources : Banque Mondiale, OCDE, calculs par l’auteur ; * basé sur les revenus, sans prise en compte du patrimoine des ménages
This brief overview shows a number of things that are important to remember at a time when demoralization and pessimism all too easily prevail. Firstly, it is not true to say that the ‘European social model’ is dead. The proof is that in some countries inequalities are being reduced, thanks in particular to the maintenance of social buffers. Secondly, overall, the European social model is still strong enough to resist rather well to many turbulences (financial crisis, recession and pandemic). At the same time, the welfare state is also in a state of financial distress. We need only think of the particularly poor state of health care in some countries, the under-funded public services that are leading to a decline in the quality of services provided to the population, the crisis in the education systems, and the shortcomings of the social welfare systems, with restrictive access to replacement incomes that are often insufficient to meet real needs. We should also mention the scale of unsatisfied social needs that citizens will never be able, with the low incomes or poorly paid jobs to which they still have access, to meet themselves. Too many people are constrained to substandard housing and cant afford a decent living conditions. There is the deteriorating health after years of work not to forget specific social services in terms of education or human care for the elderly, etc. There is a vast amount of work to be done but I won’t go into all of it here…
I will simply conclude by reminding you that there have been social setbacks before and that nothing is lost. That’s why in the second part of this trilogy, I’ll be looking at the Belgian social model of automatic indexation while I will tackle in the third article the issue of wage poverty, precarity and how to deal with it, focusing on a number of very different countries whose experiences could be an inspiration for collective resistance.
[1] WSI Report No. 86e, July 2023, WSI European Collective Bargaining Report – 2022 / 2023 – ISSN 2366-7079 ; Institute of Economic and Social Research (WSI) of the Hans Böckler Foundation
[2] En réalité, la chute du pouvoir d’achat fut encore plus grande lorsqu’on prend en compte l’augmentation des coûts de la vie les plus essentiels. Les données pour tous les États membres de l’UE sont fournies dans le tableau publiée en annexe de cet article.
[3] https://www.etuc.org/en/document/end-cost-living-crisis-increase-wages-tax-profits

